top of page

Creating advanced data applications and visualizations that users love
Aktiun Engineering
Oct 12, 20221 min read
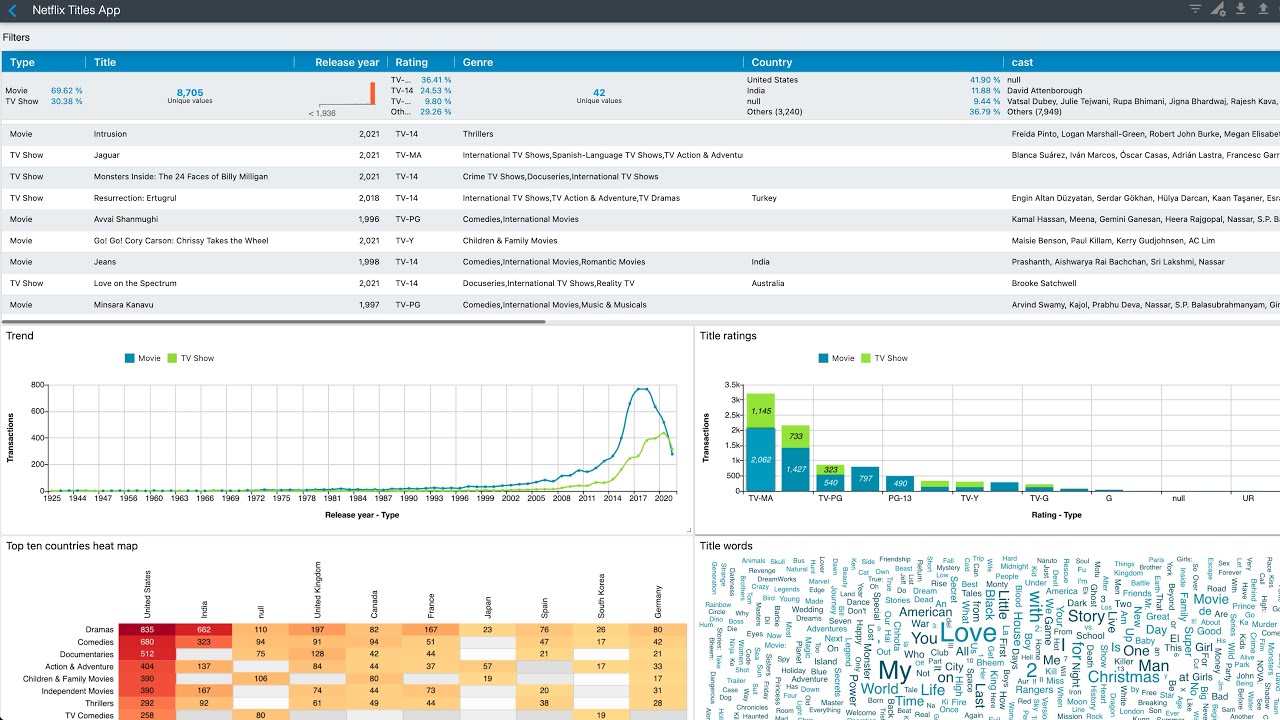
Visualizing the Netflix Titles dataset
In this video, we use ChartFactor and the Netflix Movies and TV Shows dataset provided by Shivam Bansal in Kaggle to create an...
21
0

Aktiun Engineering
Oct 5, 20221 min read
ChartFactor - Let us build it for you
There is no doubt that many are feeling the squeeze. In many large and medium-sized organisations, budgets need to be far more...
2
0

Aktiun Engineering
Sep 30, 20221 min read
ChartFactor - Presentation matters
When it comes to data, presentation matters. Effective presentation allows people to truly engage with data and helps to capture their...
7
0

Aktiun Engineering
Sep 19, 20222 min read
ChartFactor September 2022 Release
We are proud to present the September 2022 release of the ChartFactor Visual Analytics platform, the most powerful solution for embedded...
9
0

Aktiun Engineering
Jun 28, 20221 min read
ChartFactor Py - Colors and Interactivity
This video shows how to create a beautiful interactive data application using a Data Breaches 2004-2017 dataset found in Kaggle. The...
25
0

Aktiun Engineering
Jun 22, 20222 min read
ChartFactor June 2022 Release
The June 2022 release of the ChartFactor Visual Analytics Platform is now available, focusing on simplicity and effortlessness for...
19
0

Aktiun Engineering
Apr 12, 20221 min read
ChartFactor Py on Kaggle
This video shows you how to explore your Pandas DataFrames in Kaggle using ChartFactor Py. We read the Healthy Lifestyle Cities 2021...
23
0

Aktiun
Mar 16, 20222 min read
Aktiun Announces ChartFactor Py - Interactive Visual Analytics For Pandas DataFrames
Powerful visualizations and instant filtering give JupyterLab, Jupyter Notebook, and Kaggle users improved productivity when working with...
28
0

Aktiun Engineering
Dec 13, 20211 min read
Creating an interactive data application step by step
In 3 mins 12 secs this ChartFactor Community demo walks you through the creation of a web data application that allows you to explore and...
11
0

Aktiun Engineering
Nov 15, 20211 min read
ChartFactor November 2021 Release
The November 2021 release of the ChartFactor Visual Analytics Platform is now available, providing more beauty and power to our customers...
14
0

Aktiun Engineering
Oct 6, 20211 min read
ChartFactor Real Estate Statistics
At ChartFactor, sample apps use real-life data! Check out the latest Real Estate trends using our Real Estate Market Statistics app. Data...
13
0

Aktiun Engineering
Sep 28, 20211 min read
ChartFactor September 2021 Release
The September 2021 release of the ChartFactor Visual Analytics Platform is now available, adding powerful customer-driven features while...
17
0


Aktiun Engineering
Jul 15, 20211 min read
US Airline Customer Experience
With social media becoming a channel of choice, US Airlines customer experience from tweets is streaming day and night, and you can now...
29
0

Aktiun Engineering
Jun 30, 20211 min read
ChartFactor June 2021 Release
The June 2021 release of the ChartFactor Visual Analytics Platform is now available, packed with customer-driven improvements and amazing...
17
0

Aktiun Engineering
Apr 29, 20211 min read
ChartFactor April 2021 Release
The ChartFactor team is proud to present the April 2021 release of the ChartFactor Visual Analytics Platform, the most powerful solution...
18
0

Aktiun Engineering
Sep 28, 20201 min read
ChartFactor September 2020 Release
The Aktiun team is proud to present the September 2020 release of the ChartFactor Visual Analytics Platform. It increases its lead as the...
25
0
Aktiun Engineering
Jun 3, 20201 min read
Video tutorial: Embedding
Our Embedding video tutorial shows you how to embed ChartFactor Studio visualizations into your custom application with easy copy/pasting...
20
0

Aktiun Engineering
May 26, 20201 min read
China - Air pollution 2015
Replay data month by month and visualize main pollutants and air pollution levels across China's main cities.
15
0

Aktiun Engineering
May 20, 20201 min read
Video tutorial: Adding calculations
Our third ChartFactor Studio video tutorial: Adding calculations! It walks you through adding derived metrics, custom labels, and additional
9
0

Aktiun Engineering
May 12, 20201 min read
ChartFactor May 2020 Release
The May 2020 release of the ChartFactor Visual Analytics Platform is now available, adding powerful customer-driven features and...
35
0
bottom of page